Other Standardized Testing
Students participate in a number of standardized tests as part of their educational experience. Standardized tests are tests that are administered and scored the same way for all students. There are two kinds of standardized tests: norm-referenced and criterion-referenced.
Norm-Referenced Tests (NRTs) compare a student’s performance to that of other test-takers. Students take the test and are compared to a similar group of students who took the test nationally (the norm group).
Some examples of NRTs each student might take are:
- ACT (measures achievement; used for college entrance)
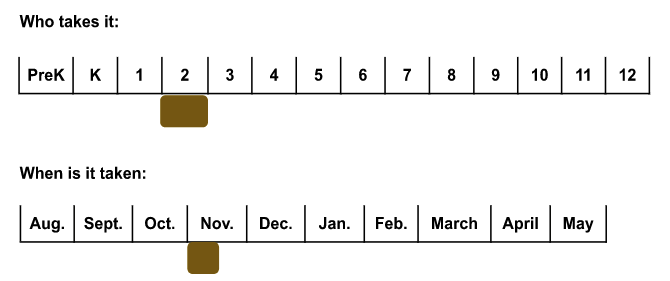
- Cognitive Abilities Tests (CogAT-measures developed cognitive abilities or resources, administered in grade 2)
- MAP Tests (national math and reading/language achievement measure, administered in grades 3, 5, and 7)
- SAT (measures achievement; used for college entrance)
District Common Assessments (DCAs) compare a student’s performance to clearly identified grade level criteria. The basis for comparison is a body of knowledge and skills.
Scores on NRTs
National Percentile Ranks (or National Percentiles) tell you the percent of students a child outscored on the exam. They range from a low of 1 to a high of 99, with average performance at 50. For example, a student who performed as well as or better than 75% of the students in the national group would earn a percentile rank of 75.
National percentile ranks indicate the relative standing of a student or group of students in comparison with other students in the same grade level who took the test at a comparable time (for example, April). They can also be used to compare a student’s or group of students’ performance across tests in the battery. A student’s score report may include percentile rank scores and a graph with gray bands. If you want to compare a student’s performance across subject areas, you need to look at the gray bands. The bands account for error in the test scores. If the bands for two subject areas do not overlap on the graph, then your child is achieving higher in one of those subject areas. For example if your student received a percentile rank of 33 in reading and 56 in math, the gray bands might range from 26 to 40 in reading and from 48 to 64 in math. The bands for math and reading would not overlap on the graph, so you would know that a student’s performance was higher in math.
When making comparisons between subject areas or grade levels for whole groups of students, a difference of at least 5 percentile ranks is meaningful (one not caused by error in the scores). For example, if second-grade students received a national percentile rank of 65 in total reading and a national percentile rank of 73 in math, we could conclude that these second graders performed better in math than in reading.
Stanines are scores that range from a low of 1 to a high of 9, with an average of 5. Stanines, like percentile ranks show a student’s or group of students’ performance compared to a group of students who took the test nationally. Stanines make it easy to identify broad performance categories. Stanines of 1, 2, or 3 are usually considered to reflect below-average performance; stanines of 4, 5, or 6 are generally thought of as average; and stanines of 7, 8, or 9 are above average. Differences of at least 2 stanines are considered to be meaningful differences for both individual students and for groups of students.
The Nebraska Reading Improvement Act
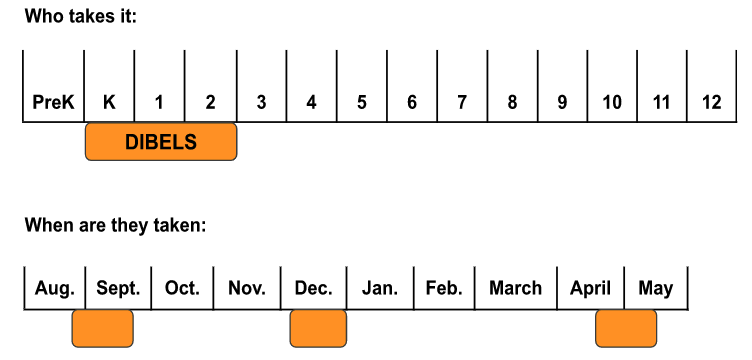
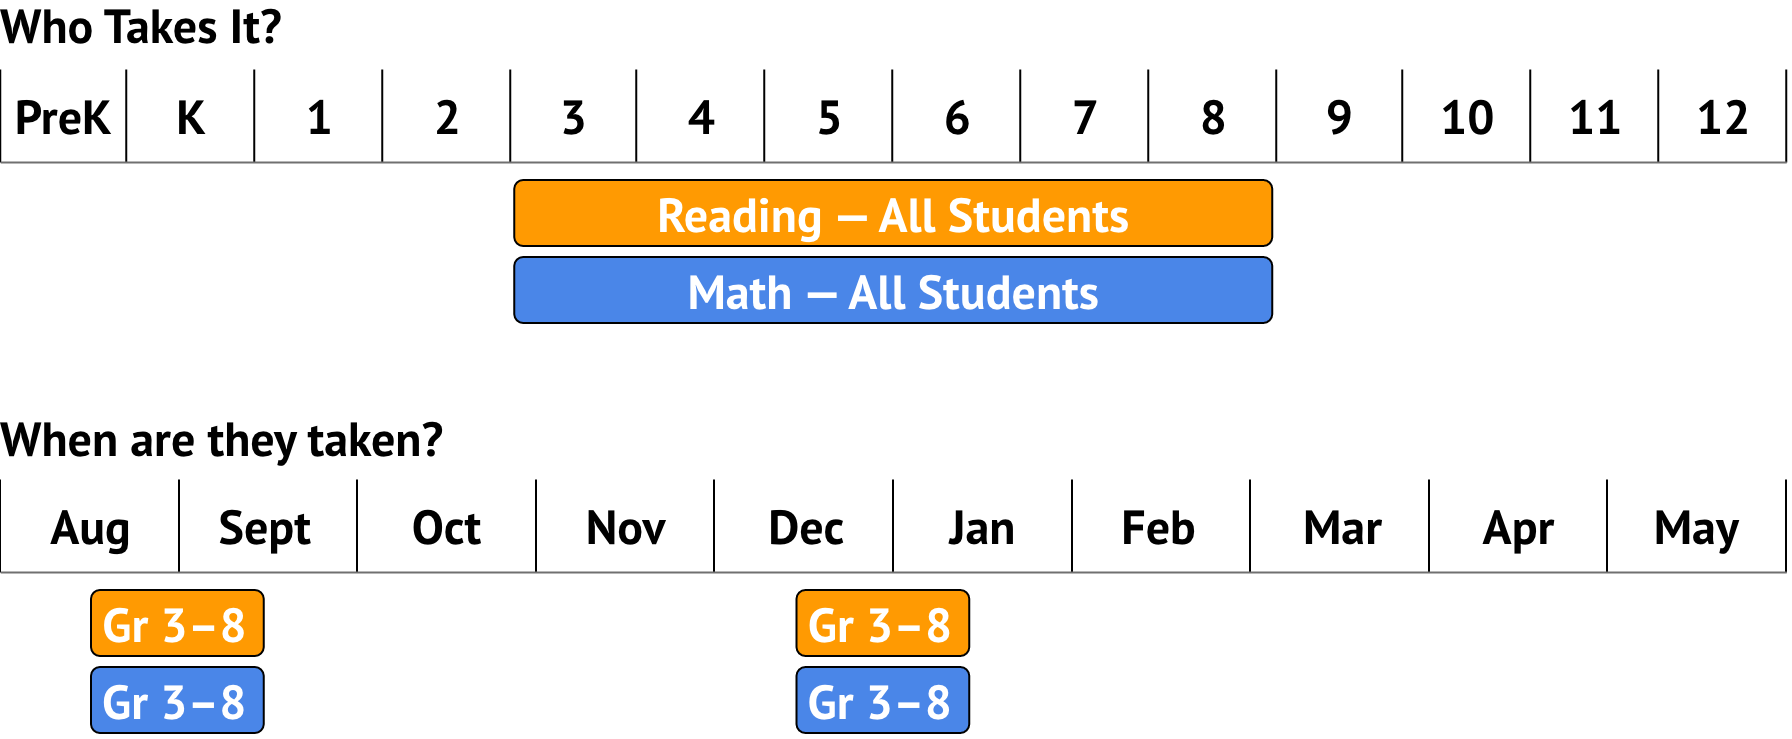
What is it: In April of 2018 LB1081 was passed by Nebraska Legislature. This law requires kindergarten – third grade students to be tested three times a year to ensure high quality reading instruction and intervention. DIBELS is the assessment Lincoln Public Schools has chosen to give to K-2nd grade students. Grade three students take MAP Growth and NSCAS to meet this requirement.
Go to the Nebraska Department of Education website to learn more information about the Nebraska Reading Improvement Act, or to see the policy.
What are the results used for: DIBELS is used with other information about students to develop Individual Reading Improvement Plans under the Nebraska Reading Improvement Act.
MAP Growth
What is it: The MAP Growth tests are norm-referenced reading and math achievement tests used in LPS.
What are the results used for: MAP Growth is one of the pieces of evidence teachers and administrators use to plan instruction and monitor student growth. Parents and students can use the results to understand students’ achievement and growth. MAP Growth information is also used to help evaluate the effectiveness of instruction, curricular materials, and programs. Teachers also use these results for students in grades 3 to develop Individual Reading Improvement Plans under the Nebraska Reading Improvement Act.
Cognitive Abilities Test Screener (CoGAT Screener)
What is it: The CogAT screener is a nationally-normed measure of students’ learned reasoning abilities developed through in-school and out-of-school experiences. The test consists of verbal, quantitative (numbers), and non-verbal reasoning and problem solving items.
What are the results used for: CogAT Screener results are one of the pieces of evidence used to identify students for the gifted program.